Analyzing Performance
As we have seen, Next.js applications can be extremely fast out of the box, thanks to features like automatic static optimization and route prefetching. However, it is sill extremely important to ensure that your code is correctly using all of the resources available to achieve the best experience possible for your users.
Core Web Vitals
In May of 2020, Google introduced "Core Web Vitals", a subset of their "Web Vitals" metrics, designed to focus on distinct facets of the user experience:
Core Web Vitals are the subset of Web Vitals that apply to all web pages, should be measured by all site owners, and will be surfaced across all Google tools. Each of the Core Web Vitals represents a distinct facet of the user experience, is measurable in the field, and reflects the real-world experience of a critical user-centric outcome.
The metrics that make up Core Web Vitals will evolve over time. The current set for 2020 focuses on three aspects of the user experience: loading, interactivity, and visual stability
By providing a guideline and metrics for creating performant web sites, Google has made it easier for developers to identify and fix potential problems:
Site owners should not have to be performance gurus in order to understand the quality of experience they are delivering to their users. The Web Vitals initiative aims to simplify the landscape, and help sites focus on the metrics that matter most.
Additionally, "Core Web Vitals" have been added to Google's "page experience signals", which have an impact on how your site is ranked in Google. Therefore it is imperative that we understand Core Web Vitals and how we can measure and improve them.
Next.js has provided an excellent introduction for these metrics in their documentation:
Largest Contentful Paint (LCP)
The Largest Contentful Paint (LCP) metric looks at the loading performance of your page. LCP measures the time it takes to get the largest element on the page visible within the viewport. This could be a large text block, video, or image that takes up the primary real estate on the page.
As the DOM is rendered, the largest element on the page may change. The Largest Contentful Paint doesn't stop counting until the largest image or element is seen on-screen.
According to Google, sites should strive to have Largest Contentful Paint take 2.5 seconds or less.

First Input Delay (FID)
The First Input Delay (FID) metric measures the time from when a user first interacts with a page (i.e. when they click a link, tap on a button, or use a custom, JavaScript-powered control) to the time when the browser is actually able to begin processing event handlers in response to that interaction.
The First Input Delay (FID) metric helps measure your user's first impression of your site's interactivity and responsiveness.
According to Google, sites should strive to have a First Input Delay of 100 milliseconds or less.

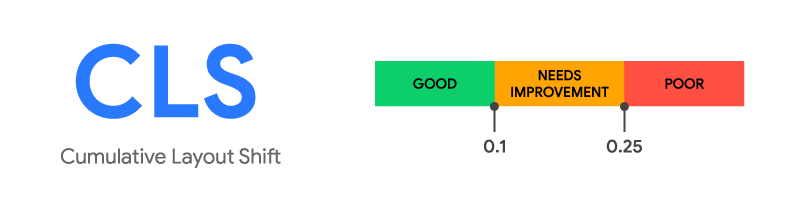
Cumulative Layout Shift (CLS)
The Cumulative Layout Shift (CLS) metric is a measure of your site’s overall layout stability. A site that unexpectedly shifts layout as the page loads can lead to accidental user error and distraction.
Cumulative Layout Shift (CLS) occurs when elements have been shifted after initially being rendered by the DOM. For example, a button rendered to the screen after a text block, which then causes the block to shift downward would be considered a layout shift.
A combination of impact and distance is considered when calculating CLS.
According to Google, sites should should strive to have a CLS score of 0.1 or less
Introduction to Lighthouse
Now that we are aware of what the "Core Web Vitals" are in a nutshell, how do we go about measuring them? Fortunately, Google has created a tool called "Lighthouse", which not only measures Core Web Vitals, but other important metrics as well:
Lighthouse is an open-source, automated tool for improving the quality of web pages. You can run it against any web page, public or requiring authentication. It has audits for performance, accessibility, progressive web apps, SEO and more.
You can run Lighthouse in Chrome DevTools, from the command line, or as a Node module. You give Lighthouse a URL to audit, it runs a series of audits against the page, and then it generates a report on how well the page did. From there, use the failing audits as indicators on how to improve the page. Each audit has a reference doc explaining why the audit is important, as well as how to fix it.
While Lighthouse is integrated directly into the Chrome DevTools (available in the "Lighthouse" panel), you may wish to access lighthouse in one of the other methods specified above. For more information, see:
NOTE: Lighthouse is also available as a GitHub action, which allows us to use it in our CI pipeline. Using this, It is possible to set minimum acceptable scores for various performance metrics, which result in errors if not met. This can help to reduce performance-related bugs from being introduced into production.
See the documentation for the CI Action for more information.
Analyzing Page Load
While we can run Lighthouse on any page, it would be best to see what kind of results we would obtain from a simple Next.js app without any additional optimizations (discussed in: Improving / Optimizing Performance). To begin, download the Example Code and open the folder "app" in Visual Studio Code. Here you will find the familiar "my-app" folder containing a Next.js app.
As usual, before proceeding, you will need to change to the "my-app" folder and execute the commands:
npm install
npm run dev
Since we will be using "Lighthouse" to measure the performance of this app, we should ideally be opening it in Google Chrome.
Once it's running, you will notice that it's a fairly simple app that shows a searchable accordion list of films in a collection. To obtain the data, It pulls the films from an "/api/movies" endpoint, specified in our "pages/api/movies.js" file.
Let's go ahead and see how well this app performs in Lighthouse:
Open a new "incognito" window in Google Chrome and navigate to the locally running app: http://localhost:3000
Open the "Developer Tools" and Switch to the "Lighthouse" tab
For this first run, check the "Performance", "Accessability", "Best Practices" and "SEO" Categories:
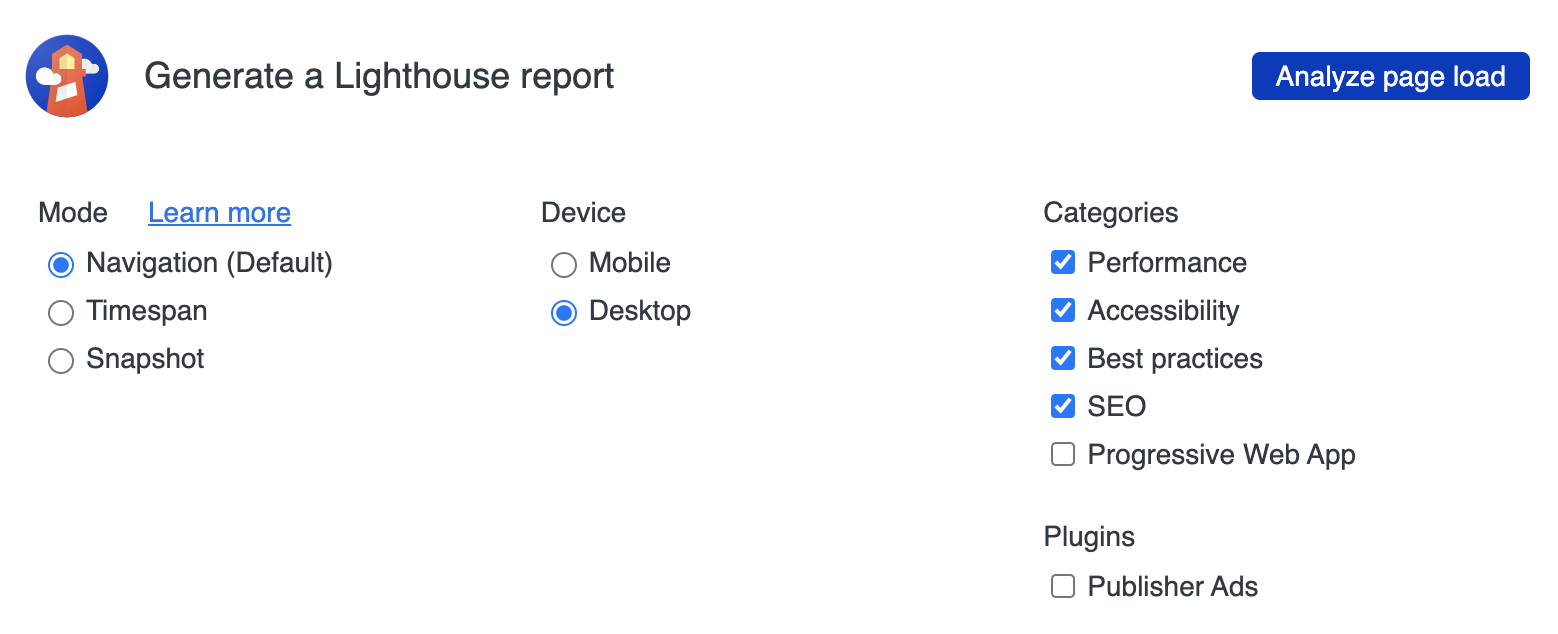
- Click the Analyze Page Load button and wait for the audit to finish.
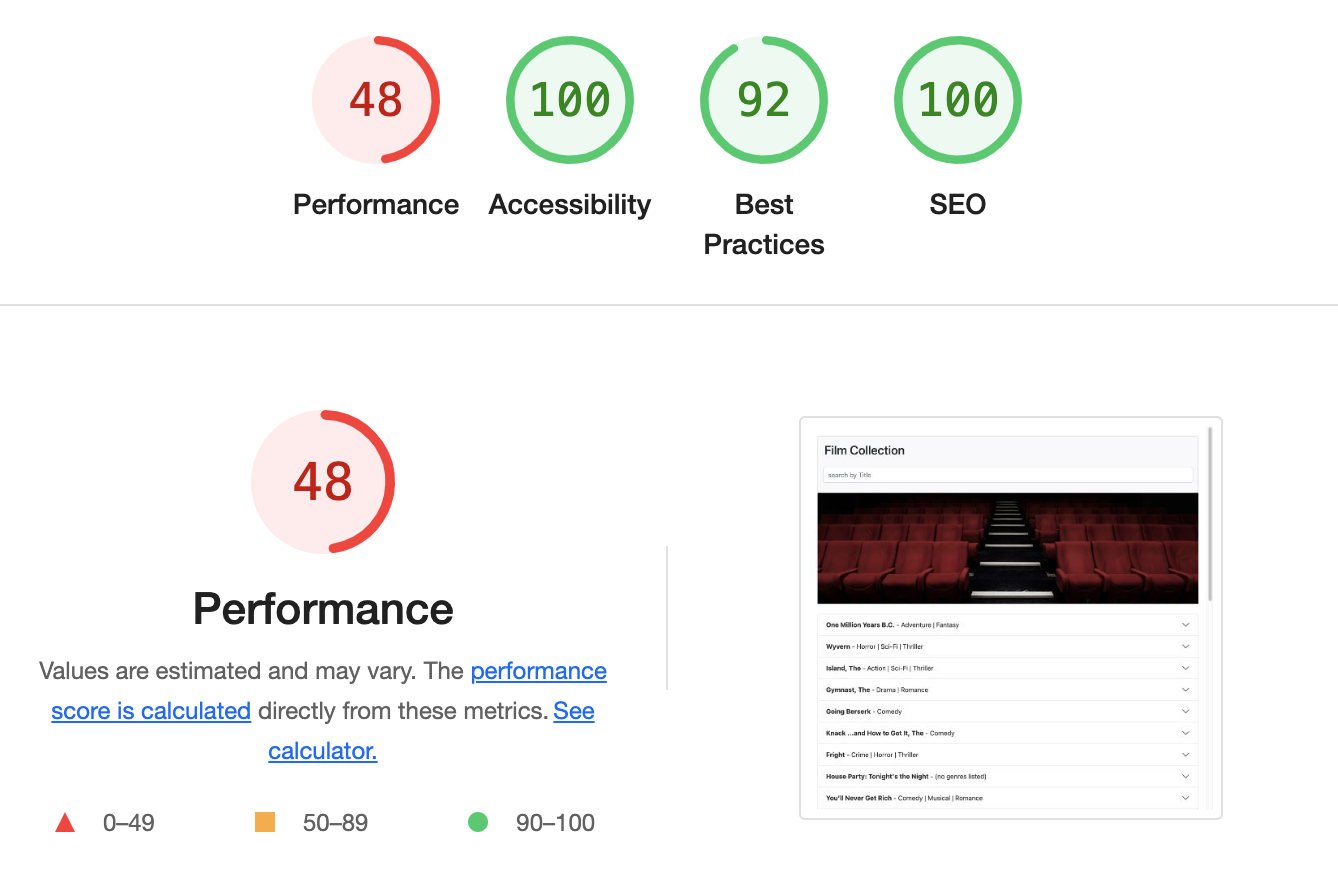
It appears that things are looking pretty good, except for the performance section. If we look at the code for the app, it doesn't seem like there's all that much we can do to improve performance, at first glance. However, Next.js has some built-in techniques and components that we can use to optimize our initial page load and help to improve that result.
Important Note: The performance numbers will improve if we do a production build before starting the app (using
npm start) and testing it with Lighthouse. However, the above report does shine some light on potential areas of improvement that we should explore before going to production.